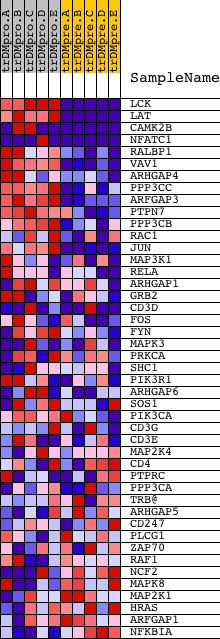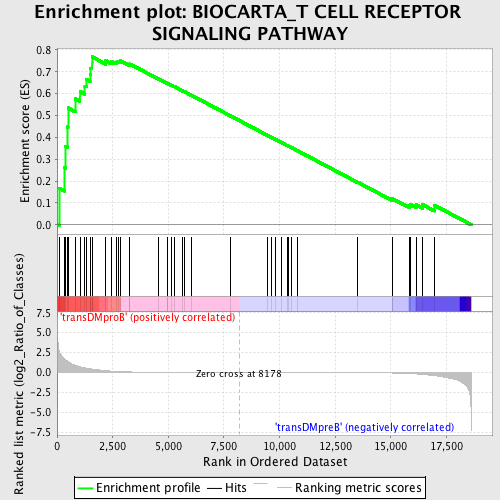
Profile of the Running ES Score & Positions of GeneSet Members on the Rank Ordered List
| Dataset | Set_04_transDMproB_versus_transDMpreB.phenotype_transDMproB_versus_transDMpreB.cls #transDMproB_versus_transDMpreB.phenotype_transDMproB_versus_transDMpreB.cls #transDMproB_versus_transDMpreB_repos |
| Phenotype | phenotype_transDMproB_versus_transDMpreB.cls#transDMproB_versus_transDMpreB_repos |
| Upregulated in class | transDMproB |
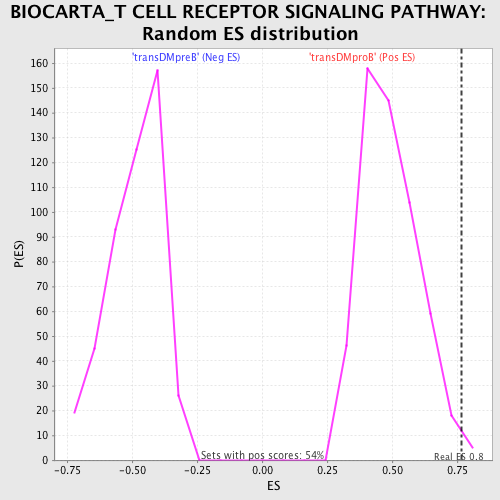
| GeneSet | BIOCARTA_T CELL RECEPTOR SIGNALING PATHWAY |
| Enrichment Score (ES) | 0.7683897 |
| Normalized Enrichment Score (NES) | 1.5546236 |
| Nominal p-value | 0.009345794 |
| FDR q-value | 0.314438 |
| FWER p-Value | 0.703 |
| PROBE | DESCRIPTION (from dataset) | GENE SYMBOL | GENE_TITLE | RANK IN GENE LIST | RANK METRIC SCORE | RUNNING ES | CORE ENRICHMENT | |
|---|---|---|---|---|---|---|---|---|
| 1 | LCK | 15746 | 101 | 2.651 | 0.1662 | Yes | ||
| 2 | LAT | 17643 | 323 | 1.671 | 0.2625 | Yes | ||
| 3 | CAMK2B | 20536 | 391 | 1.552 | 0.3594 | Yes | ||
| 4 | NFATC1 | 23398 1999 5167 9455 1985 1957 | 464 | 1.425 | 0.4478 | Yes | ||
| 5 | RALBP1 | 9725 | 491 | 1.363 | 0.5347 | Yes | ||
| 6 | VAV1 | 23173 | 813 | 0.905 | 0.5760 | Yes | ||
| 7 | ARHGAP4 | 9343 | 1028 | 0.704 | 0.6101 | Yes | ||
| 8 | PPP3CC | 21763 | 1251 | 0.569 | 0.6350 | Yes | ||
| 9 | ARFGAP3 | 22183 | 1323 | 0.535 | 0.6658 | Yes | ||
| 10 | PTPN7 | 11500 | 1482 | 0.468 | 0.6876 | Yes | ||
| 11 | PPP3CB | 5285 | 1499 | 0.461 | 0.7166 | Yes | ||
| 12 | RAC1 | 16302 | 1568 | 0.428 | 0.7407 | Yes | ||
| 13 | JUN | 15832 | 1569 | 0.428 | 0.7684 | Yes | ||
| 14 | MAP3K1 | 21348 | 2190 | 0.232 | 0.7501 | No | ||
| 15 | RELA | 23783 | 2432 | 0.175 | 0.7484 | No | ||
| 16 | ARHGAP1 | 6001 10448 | 2662 | 0.136 | 0.7449 | No | ||
| 17 | GRB2 | 20149 | 2736 | 0.123 | 0.7490 | No | ||
| 18 | CD3D | 19473 | 2843 | 0.107 | 0.7502 | No | ||
| 19 | FOS | 21202 | 3267 | 0.066 | 0.7317 | No | ||
| 20 | FYN | 3375 3395 20052 | 3271 | 0.066 | 0.7358 | No | ||
| 21 | MAPK3 | 6458 11170 | 4552 | 0.016 | 0.6679 | No | ||
| 22 | PRKCA | 20174 | 4949 | 0.012 | 0.6474 | No | ||
| 23 | SHC1 | 9813 9812 5430 | 4950 | 0.012 | 0.6482 | No | ||
| 24 | PIK3R1 | 3170 | 5127 | 0.011 | 0.6394 | No | ||
| 25 | ARHGAP6 | 24207 | 5279 | 0.010 | 0.6319 | No | ||
| 26 | SOS1 | 5476 | 5657 | 0.008 | 0.6121 | No | ||
| 27 | PIK3CA | 9562 | 5742 | 0.007 | 0.6081 | No | ||
| 28 | CD3G | 19139 | 6019 | 0.006 | 0.5936 | No | ||
| 29 | CD3E | 8714 | 7772 | 0.001 | 0.4993 | No | ||
| 30 | MAP2K4 | 20405 | 9477 | -0.003 | 0.4078 | No | ||
| 31 | CD4 | 16999 | 9641 | -0.003 | 0.3992 | No | ||
| 32 | PTPRC | 5327 9662 | 9818 | -0.004 | 0.3900 | No | ||
| 33 | PPP3CA | 1863 5284 | 10074 | -0.004 | 0.3765 | No | ||
| 34 | TRB@ | 1157 | 10348 | -0.005 | 0.3622 | No | ||
| 35 | ARHGAP5 | 4412 8625 | 10422 | -0.005 | 0.3586 | No | ||
| 36 | CD247 | 4498 8715 | 10534 | -0.006 | 0.3530 | No | ||
| 37 | PLCG1 | 14753 | 10822 | -0.007 | 0.3380 | No | ||
| 38 | ZAP70 | 14271 4042 | 13496 | -0.022 | 0.1955 | No | ||
| 39 | RAF1 | 17035 | 15064 | -0.065 | 0.1153 | No | ||
| 40 | NCF2 | 14098 5151 9446 | 15081 | -0.066 | 0.1187 | No | ||
| 41 | MAPK8 | 6459 | 15826 | -0.132 | 0.0872 | No | ||
| 42 | MAP2K1 | 19082 | 15878 | -0.140 | 0.0935 | No | ||
| 43 | HRAS | 4868 | 16140 | -0.184 | 0.0914 | No | ||
| 44 | ARFGAP1 | 14705 2854 | 16430 | -0.249 | 0.0920 | No | ||
| 45 | NFKBIA | 21065 | 16968 | -0.396 | 0.0887 | No |